Debugging a Running httpd Binary Inside Firmware Using GDB [Part 1]
In IoT firmware exploitation, control comes from understanding execution at runtime. Most devices expose their functionality through a web interface, and behind that interface sits a lightweight server binary (httpd). Learn how live debugging turns crashes into controlled execution.
This blog post is published for research and learning purposes only. It explains live debugging of firmware binaries (GDB / gdbserver) in a lab or authorised research setting. Techniques described here must only be used on devices and systems you own, or for which you have explicit written permission to test. Unauthorised access to computer systems is illegal. CyberKartel is not responsible for misuse of the information in this article.
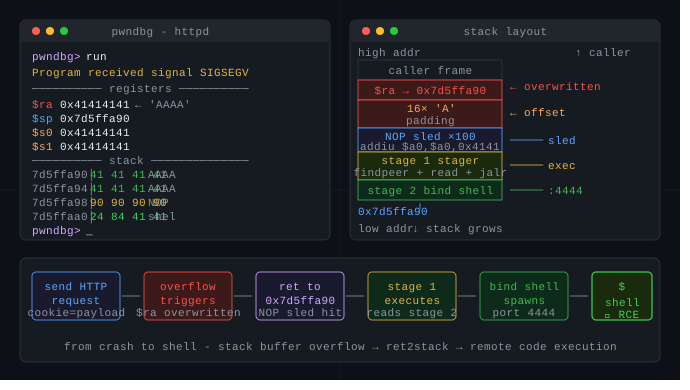
In IoT firmware exploitation, control comes from understanding execution at runtime. Most devices expose their functionality through web interface, and behind that interface sits a lightweight server binary (httpd). httpd binary is responsible for handling all incoming HTTP requests. If this binary can be controlled, the device itself can be controlled.
Static analysis can reveal vulnerable code paths, but it cannot reliably tell us where user input lands in memory while the binary is running. Stack layouts change, buffers are reused, and offsets that look valid in disassembly often fail in real execution. This is why debugging a live httpd process is critical for real-world RCE.
By attaching GDB to a running httpd binary inside firmware, we can observe the exact stack state during request handling, calculate precise runtime offsets, and identify where controlled data overwrites critical values such as saved return addresses. These runtime offsets are the foundation of reliable exploitation - they turn crashes into controlled execution.
This blog focuses on how live debugging enables that transition: from understanding a binary to taking control of it, and ultimately, the device itself.
Embedding gdbserver Inside Firmware
The process is straightforward: a statically linked gdbserver binary matching the device architecture (MIPS or ARM) is placed inside the firmware root filesystem. Once the firmware boots, gdbserver can be launched to attach to an already running httpd process or start it under debugger control, without disrupting the rest of the system.

gdbserver binary inside filesystem
Debugging is then performed from the host machine, where a full-featured GDB (with extensions like pwndbg) connects remotely. This cross-architecture model allows deep runtime inspection - stack, registers, and memory - while keeping the device-side footprint minimal. At this point, the firmware stops being a black box and becomes a live, observable execution environment.
Attaching GDB to a Live httpd Process
1. Identify the Running httpd Process - On the device (serial / telnet / SSH):
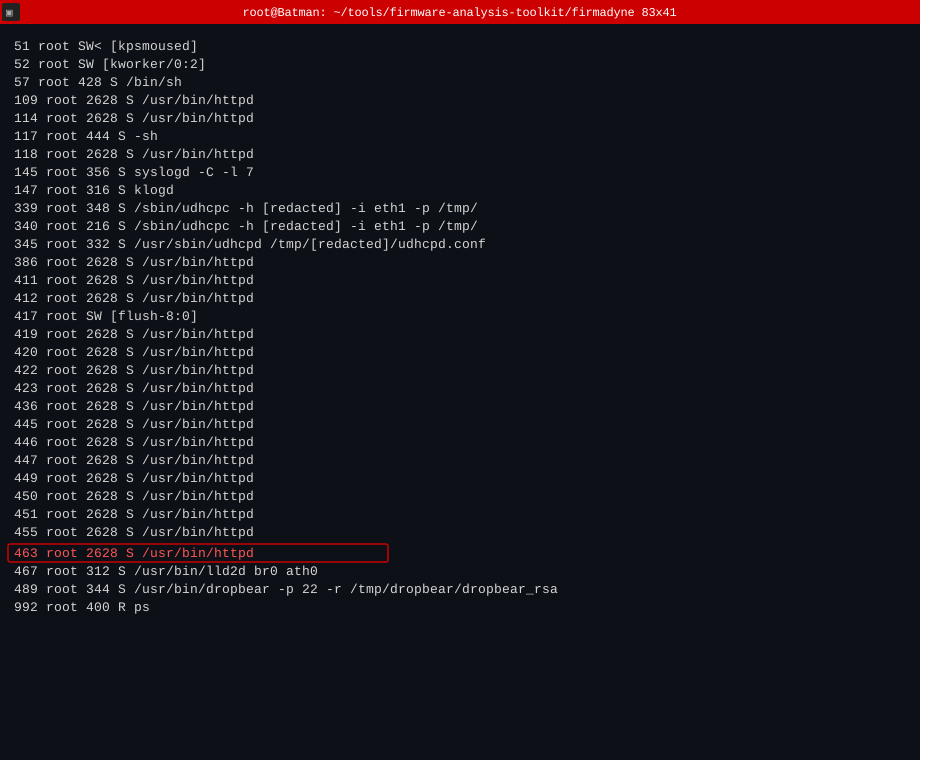
Running Processes
2. Attach gdbserver to the Running httpd - gdbserver :1234 --attach <PID>
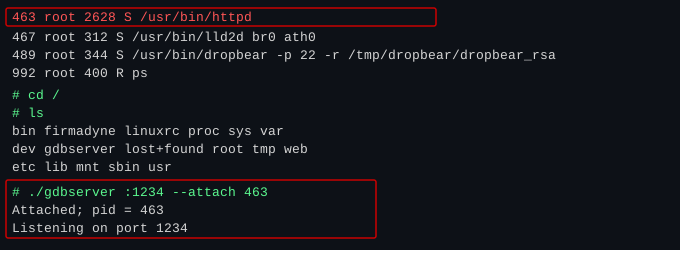
Attaching httpd to gdbserver
At this point httpd is paused. The process state is frozen at its current instruction.
3. Connect from Host Machine (GDB-Multiarch) - First install GDB-Multiarch on the host system. We can use pwndbg extension for GDB - it has many predefined functions, commands, and configuration options that automate tasks and provide a more informative environment for exploit development and reverse engineering within GDB.
gdb-multiarch ./httpd - We need to give the local path to httpd (gdb ./httpd) not to run it, but to tell GDB what binary layout it should understand. The binary is already running on the target. The local copy is used only for analysis context.
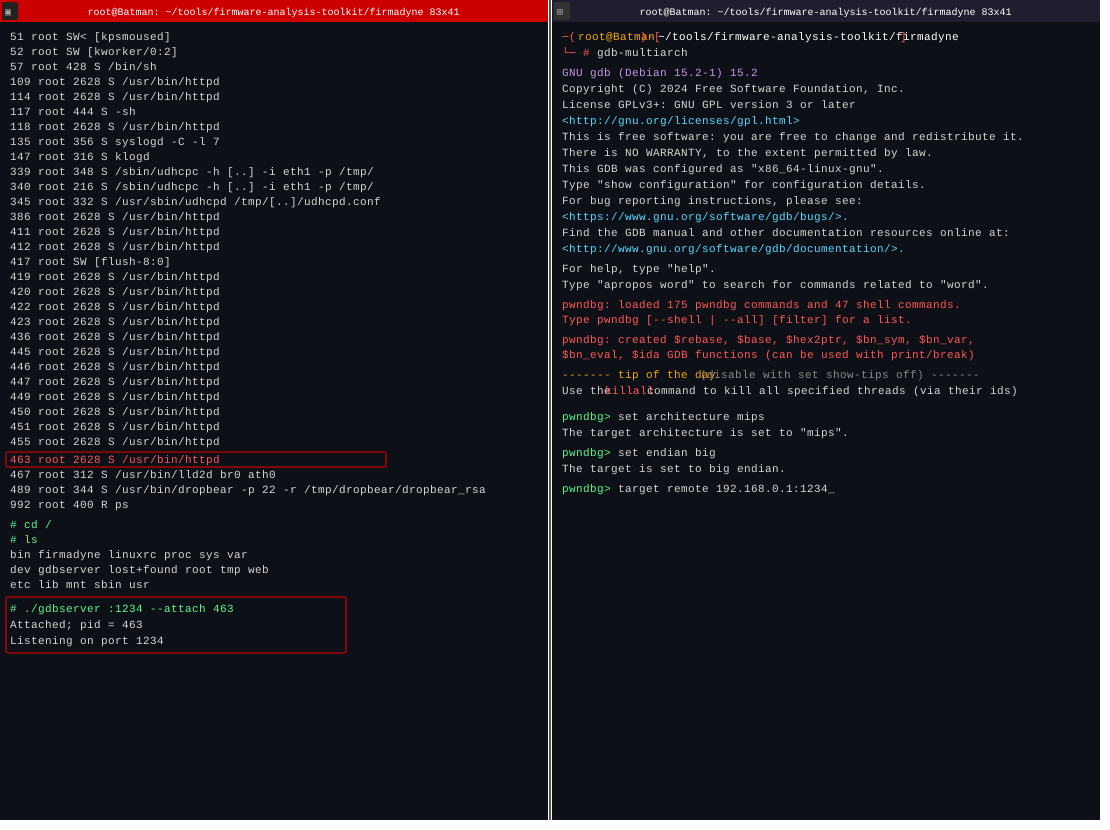
Connecting gdb-multiarch to gdbserver
Observing the Runtime Behaviour of the Binary
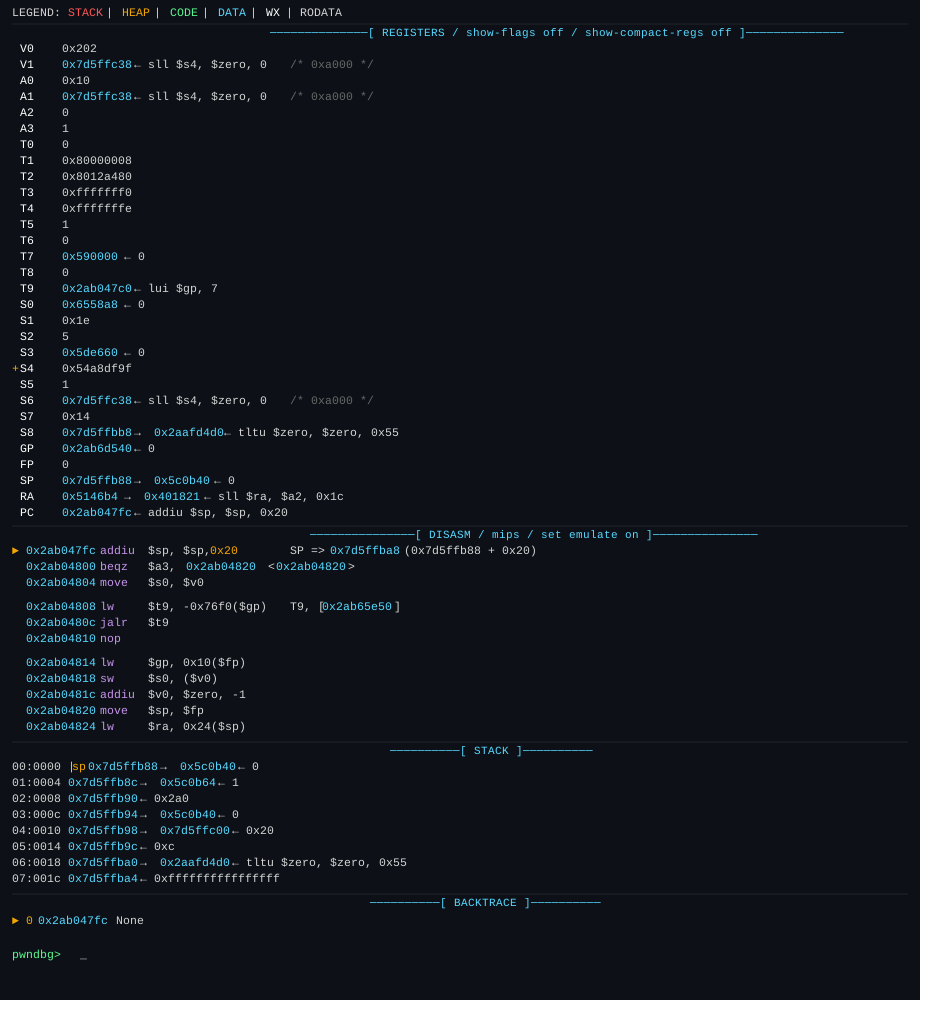
Debugging view
Now we have successfully attached the server binary to gdb-multiarch. The debugging interface is showing: a) Registers Pane (Top Left): Shows live CPU register values (MIPS): SP, RA, PC, argument registers, and saved registers. This is critical for tracking control flow and spotting where execution will return. b) Current Instruction / Disassembly (Middle): Displays the exact instruction being executed (addiu $sp, $sp, 0x20) along with nearby instructions. This helps identify function prologues/epilogues and stack adjustments. c) Stack View (Bottom): Shows raw stack memory at runtime. You can see saved values, local data, and potential overwrite targets relative to SP. d) Backtrace Section: Indicates the current call context (limited due to stripped binary), still useful for confirming execution depth.
Tracing the Crash
Once the debugger is attached to the running httpd process, the next step is to intentionally crash the binary. At this stage, the goal is not exploitation, but observation. A controlled crash gives us precise insight into how user-controlled input affects execution at runtime.
Since the server is already vulnerable to a buffer overflow, we send an oversized HTTP request as a payload. This payload is designed to overflow the target buffer and corrupt adjacent stack data. As the request is processed, execution eventually reaches an invalid state and the binary crashes.
The instruction pointer / return address to see where control was redirected. The stack pointer to understand the current stack layout. The stack contents to identify where our payload landed.
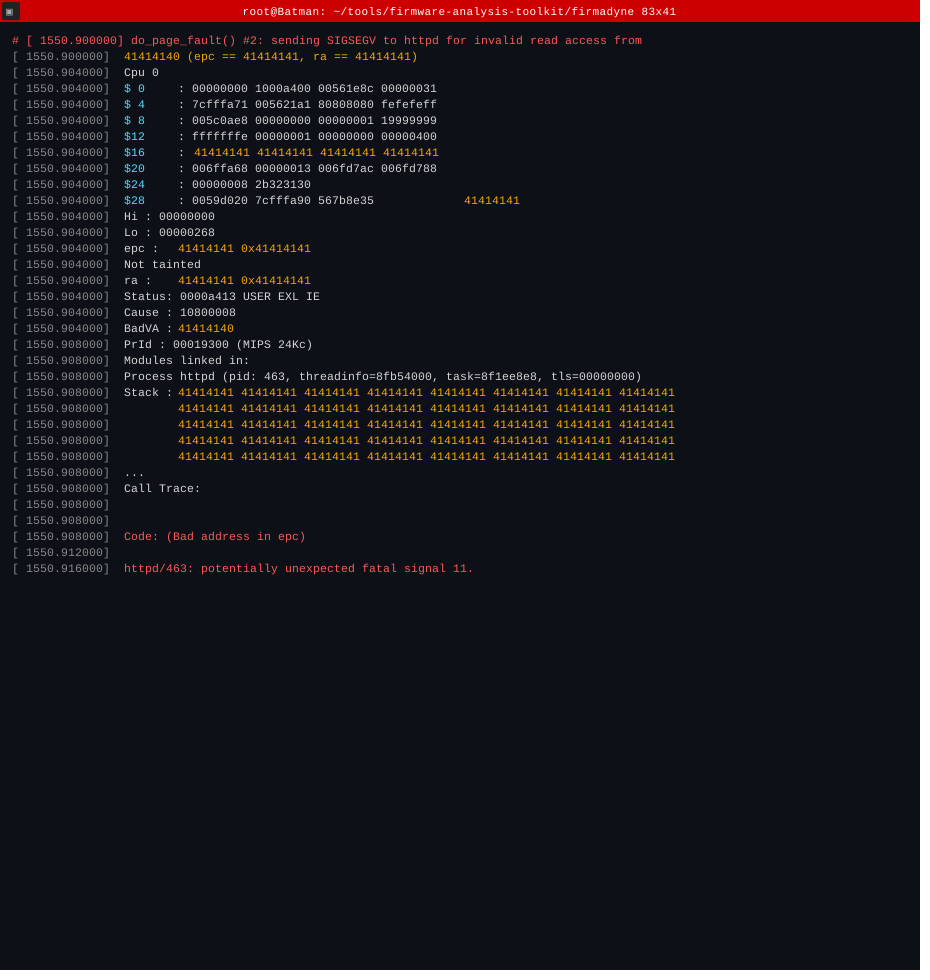
Crash Logs
Now we can see that the router crashed and there are crash logs showing 414141.. that means all the data inside the registers is overwritten with 414141, this 4141 is nothing but 'AA' because the hexadecimal value 0x41 is 'A' in ASCII. So what happened here was we triggered the overflow using a huge string of AAA inside the HTTP request and due to lack of sanitization in source code the httpd service crashed and eventually the router crashed.
Now the next step is to analyse these crash logs and see what data we have in gdb-multiarch.
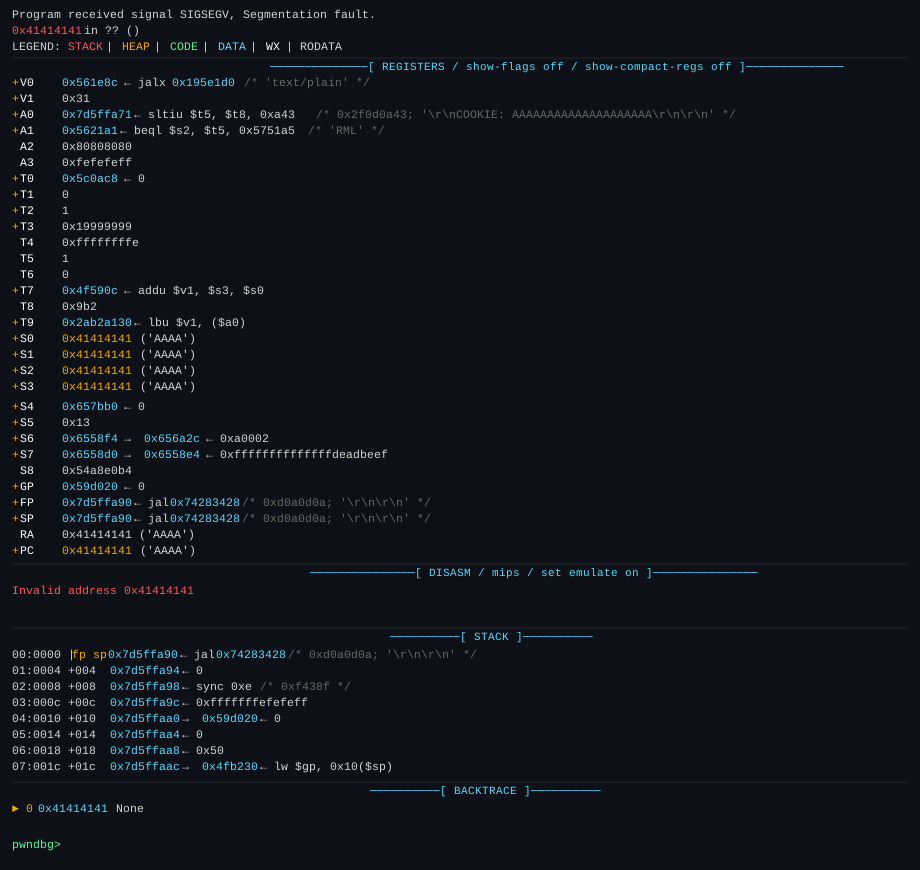
After crash data in GDB-Multiarch
The debugging output clearly shows that the httpd binary has crashed with a SIGSEGV (segmentation fault) due to an invalid memory access at address 0x41414141. This address is significant because 0x41 corresponds to the ASCII character 'A', indicating that the crash was triggered by our injected payload consisting of repeated 'A' characters. In the register view, multiple registers such as $s0, $s1, $s2, $s3, $fp, $ra, and $pc are all overwritten with 0x41414141, confirming that the input has overflowed beyond its intended buffer and corrupted critical execution state. Notably, the program counter ($pc) being set to 0x41414141 means the application attempted to execute instructions from this invalid address, directly leading to the crash. Additionally, the disassembly highlights the presence of our payload in the request, specifically within the COOKIE header ("AAAAAAAAAAAA..."), showing that user-controlled input is being processed without proper bounds checking. The stack trace further reinforces this by showing abnormal return addresses and corrupted stack frames. Overall, this behaviour strongly indicates a classic buffer overflow vulnerability, where insufficient input validation allows an attacker to overwrite memory regions, potentially leading to denial of service or even arbitrary code execution depending on exploitability.
D-Day
From the debugging state, the most critical observation is that our input has completely overwritten the execution flow. Registers such as $pc and $ra contain 0x41414141, confirming that we have full control over the return address. This is the fundamental prerequisite for any control-flow hijacking scenario and indicates that the overflow is not just causing a crash, but is also exploitable.
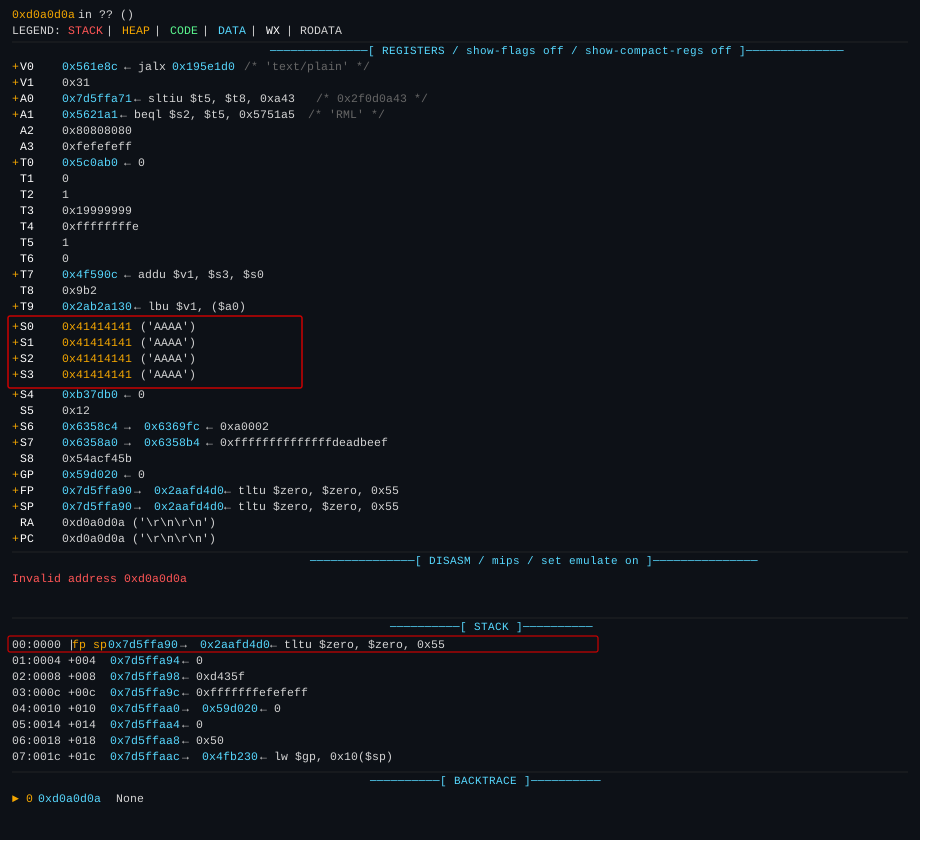
Stack pointer and other registers
Another important piece of information comes from the stack pointer ($sp). The stack pointer represents the current top of the stack and, in this case, it points to a memory region that is influenced by our payload. Since our injected data resides on the stack, $sp effectively gives us a reference to where our controlled buffer lives in memory during execution. This is crucial because, during exploitation, we need a reliable way to redirect execution to our payload (shellcode), and the stack is often the most predictable location for that.
Additionally, the presence of our payload ('AAAA') across multiple saved registers ($s0–$s3, $fp, $ra) indicates that we have exceeded the buffer boundary and can precisely control how much data is written. This allows us to calculate the exact offset required to reach and overwrite the return address. Knowing this offset is essential for crafting a structured payload where we place padding, a controlled return address, and eventually our shellcode in the correct positions.
In summary, from this debugging session we have extracted three critical elements:
- Control over the program counter ($pc) / return address ($ra)
- Visibility into the stack location via $sp
- The ability to determine the exact overflow offset
In the next part, we will use this information to develop a working exploit and demonstrate how to achieve remote code execution on the target device.